Monitoring Panel
INFO
Available since plugin version 2.1.0.
The Monitoring panel is an administration dashboard that gives a live view of the Abacus integration: how the plugin is using the Abacus API, the health of its scheduled tasks, and the result of every synchronisation job. It is the first place to look when a sync is slow, stuck, or failing.
You can find it in the administration under Settings -> Extensions -> Abacus Monitoring. The dashboard refreshes automatically, so the numbers stay current without reloading.
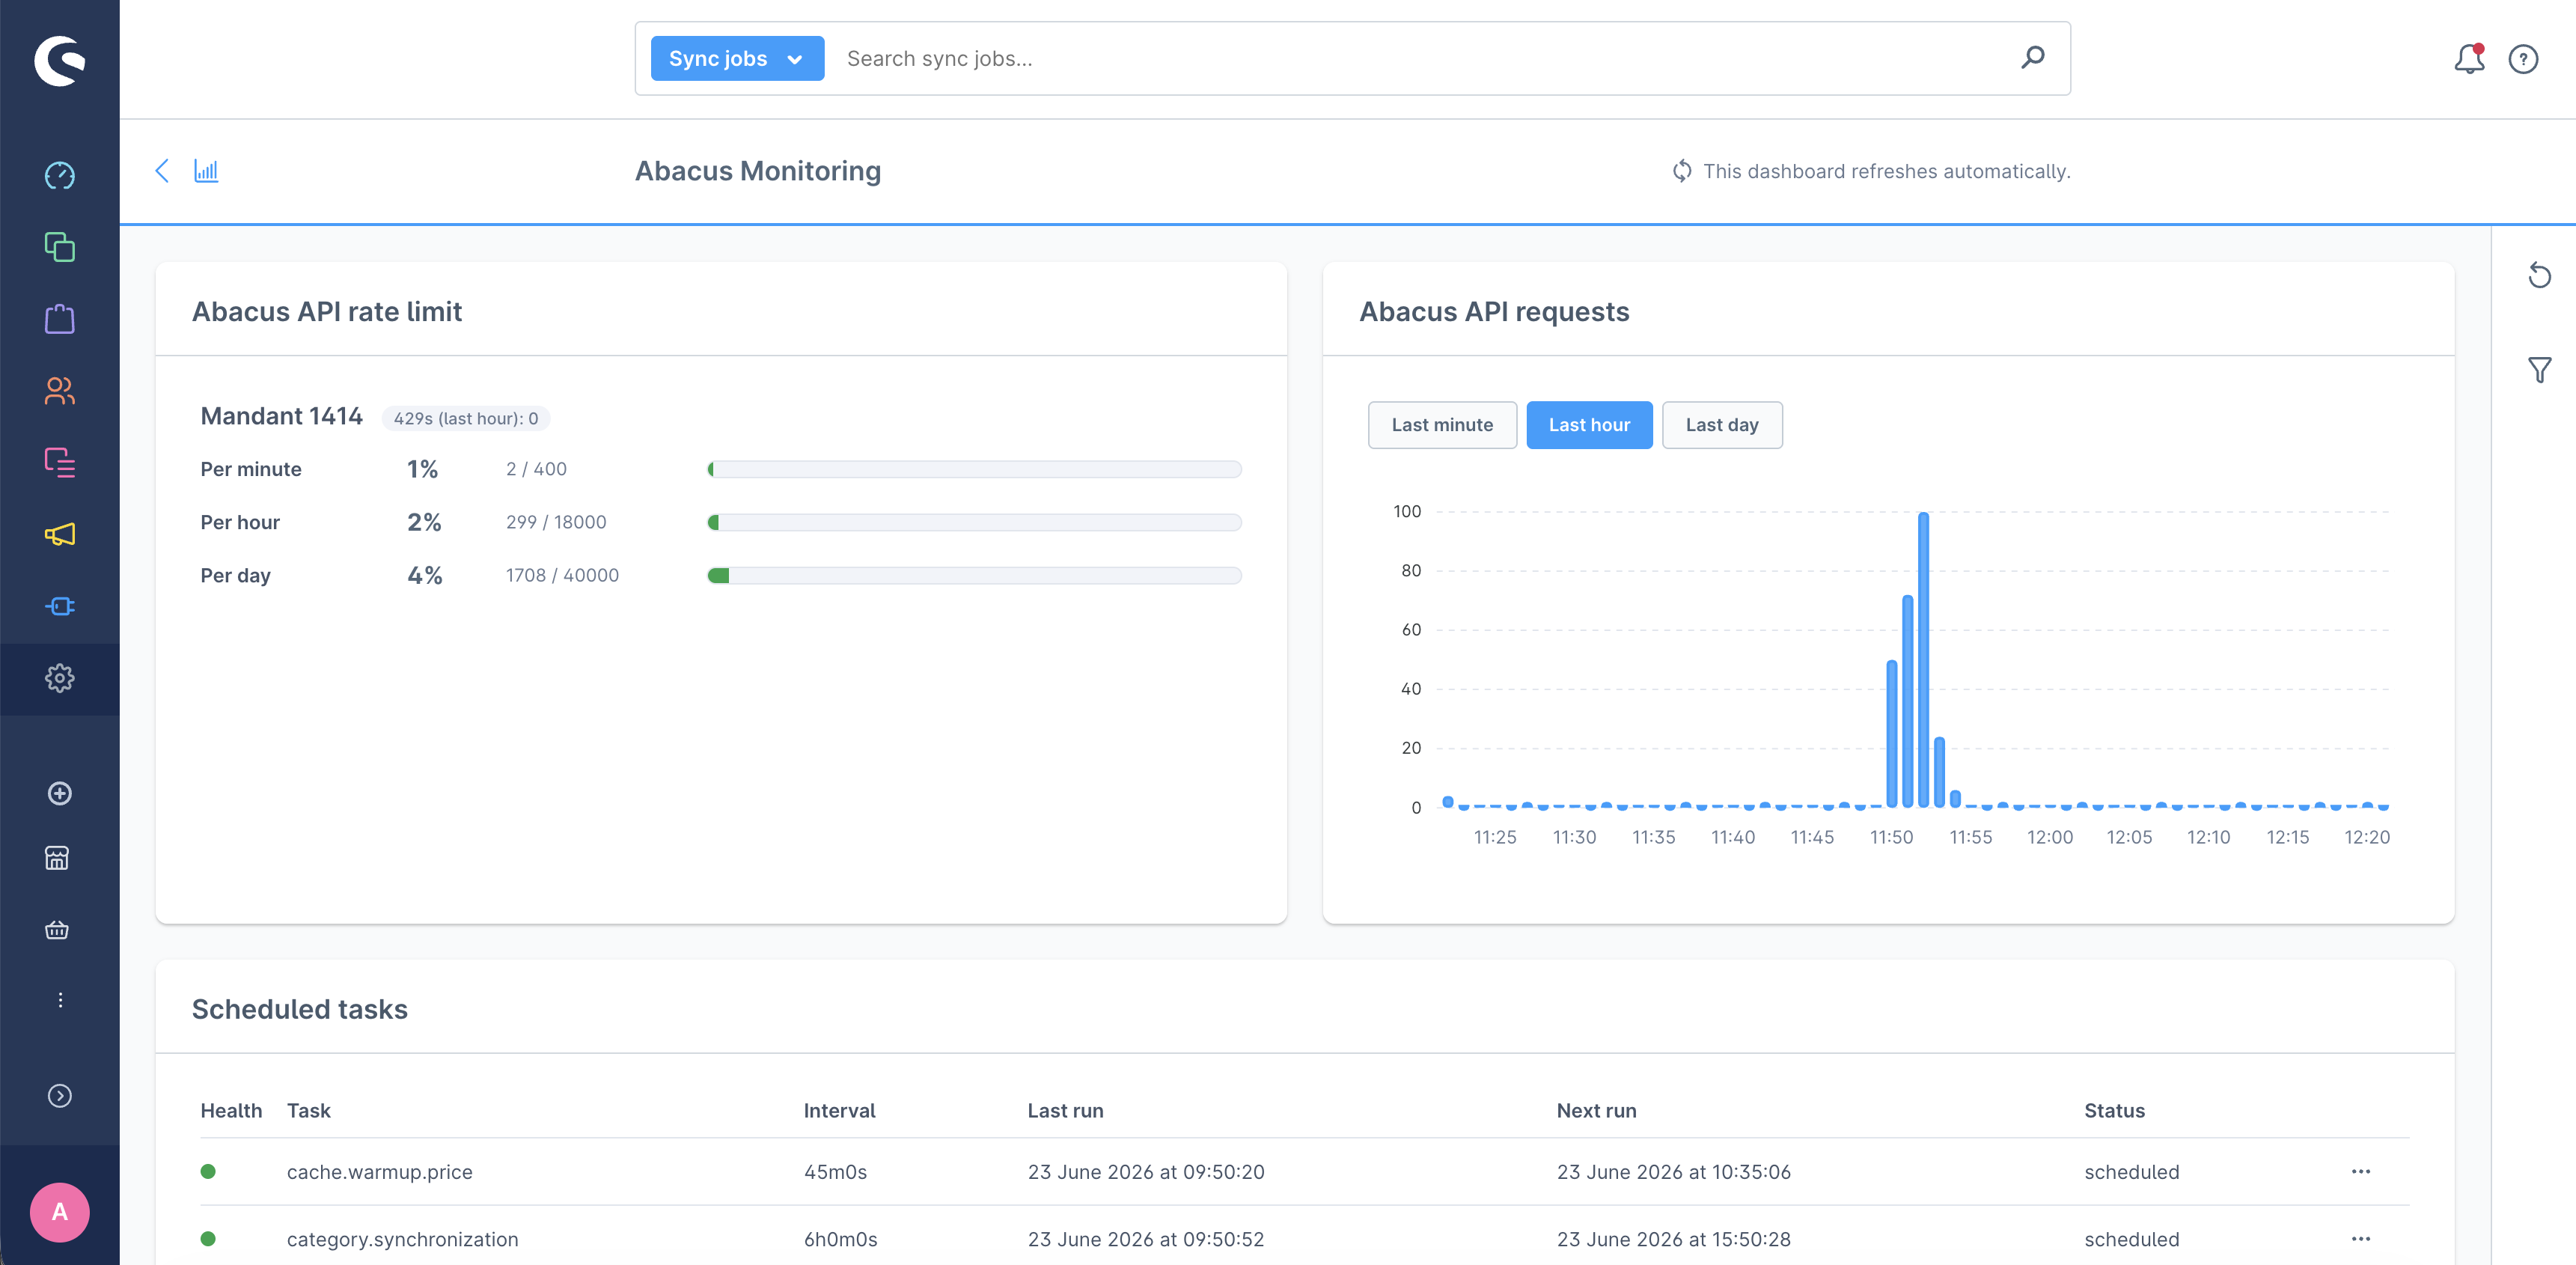
Abacus API rate limit
Shows, per Abacus mandant, how many API calls were made in the last minute, hour, and day against the limit allowed by Abacus, with a usage bar that turns from green to red as the limit gets closer. It also reports the number of 429 Too Many Requests responses received in the last hour. The limits depend on the configured Abacus version (200/12000/30000 for 2025, 400/18000/40000 for 2026+).
Please note
The panel only counts calls made by this Shopware instance. If another system is connected to the same Abacus mandant, its calls are not shown here, so the real usage against the (shared) Abacus limit can be higher than displayed.
Abacus API requests
A bar chart of API request volume over time. The range can be switched between the last minute, hour, or day, and between mandants when more than one is active. It makes it easy to spot spikes and relate them to rate limiting.
Scheduled tasks
Lists every Abacus scheduled task with its run interval, last and next run, and status. A task is flagged overdue when it has not run well past its schedule, which usually means the message queue worker is not running. Each task has a Run now action to enqueue it immediately.
Sync jobs
A searchable, filterable grid of individual synchronisation jobs. Each job has a status (pending, running, succeeded, or failed), a trigger source (scheduled, manual, console, or storefront), live progress with an estimated percentage based on the previous run of the same type, the enqueued/processed/failed/skipped counters, and timestamps. Failed jobs surface their error logs, and can be retried one by one or all at once with Retry all failed.
Background maintenance
Two scheduled tasks keep the data healthy. reap_stale_sync_jobs runs every 5 minutes and marks jobs with no activity for over 15 minutes as failed (the worker likely crashed or timed out). prune_sync_jobs runs daily and deletes succeeded jobs older than 7 days, failed jobs older than 30 days, and rate-limit data older than 5 days.